
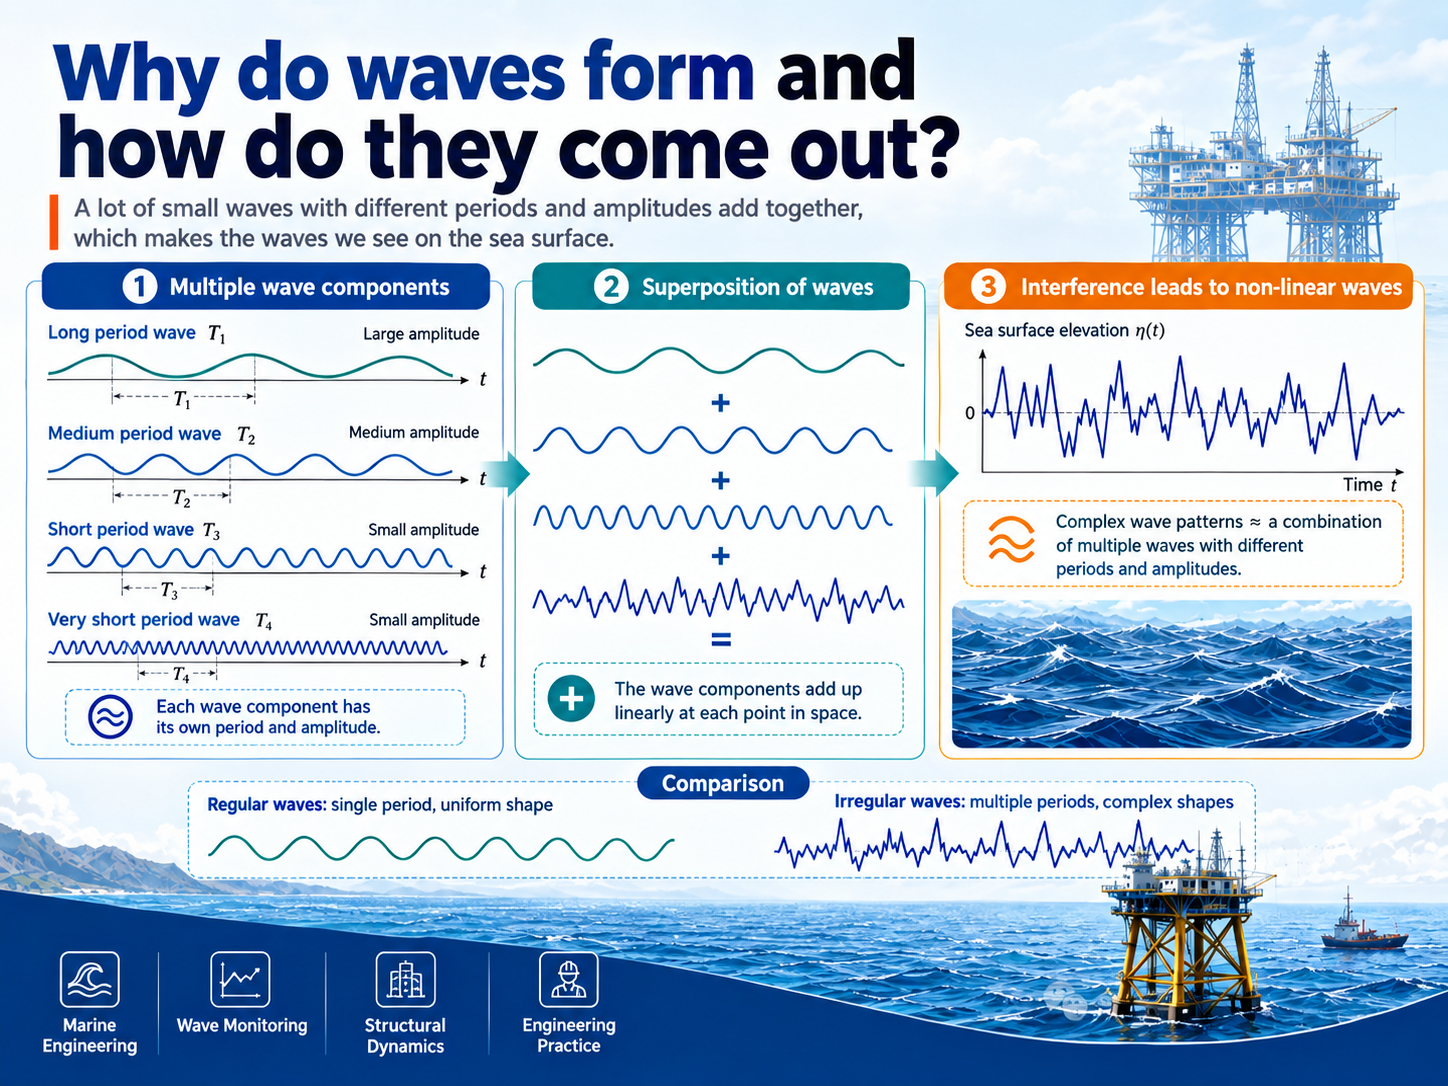
Why Can a Chaotic Sea Be Described by a Single Curve? Understanding the Wave Spectrum
The ocean surface is constantly changing, with waves varying in height, period, and direction. Although individual waves may appear random and difficult to predict, ocean engineers and researchers can describe an entire sea state using a powerful analytical tool: the wave spectrum.
What Is a Wave Spectrum?
A wave spectrum describes how wave energy or variance is distributed across different frequencies.
Instead of analyzing individual waves one by one, the spectrum provides a statistical view of the overall sea state. The horizontal axis represents wave frequency, while the vertical axis represents the spectral energy density, typically expressed in m²/Hz.
This frequency-domain approach makes complex ocean wave conditions easier to analyze, compare, and model.
Hs and Tp: Two Important Wave Parameters
Two commonly used parameters derived from a wave spectrum are:
- Significant Wave Height (Hs): Represents the overall energy level of the sea state.
- Peak Wave Period (Tp): The wave period corresponding to the frequency where the spectral energy reaches its maximum.
Hs can be derived from the zeroth spectral moment using:
Hm0 = 4√m0
And peak wave period is related to the peak frequency by:
Tp = 1/fp
However, Hs and Tp alone cannot completely describe a wave spectrum. Different spectral shapes can have similar Hs and Tp values while representing different wave conditions.
From a Spectrum to Realistic Ocean Waves
A realistic ocean surface can be represented as the superposition of many regular wave components:
η(t) = Σ aᵢ cos(2πfᵢt + φᵢ)
Each component has its own amplitude, frequency, and phase. By combining numerous components with different phases, it is possible to reconstruct realistic wave time histories from a spectrum.
This principle is widely used in ocean wave modeling, numerical simulations, and offshore engineering analysis.
PM and JONSWAP Wave Spectra
Different sea conditions can produce different spectral shapes. Two widely used models are the Pierson–Moskowitz (PM) spectrum and the JONSWAP spectrum.
The PM spectrum is commonly associated with fully developed wind seas, while the JONSWAP spectrum can represent developing wind-generated seas with a more pronounced spectral peak.
Therefore, selecting an appropriate spectral model is important when simulating or analyzing specific marine environments.
Applications in Ocean Engineering
Wave spectrum analysis plays an important role in:
- Oceanographic research
- Wave monitoring
- Offshore structure design
- Marine engineering
- Numerical wave simulation
- Coastal and offshore safety assessment
For offshore structures and marine equipment, spectral information can help engineers understand the statistical characteristics of wave loading and evaluate potential operating conditions.
Measuring the Ocean: From Data to Wave Spectrum
Reliable wave spectrum analysis depends on reliable observation data. Modern wave sensors, wave buoys, tide and wave gauges, and integrated marine observation systems can continuously collect ocean surface measurements.
These measurements can then be processed to obtain wave parameters and spectral information, helping researchers and engineers better understand changing marine conditions.
The ocean may appear chaotic, but the right measurement and analysis methods can transform complex wave motion into meaningful and usable data.
Measure the waves. Analyze the spectrum. Understand the ocean.
About Frankstar Technology
Frankstar provides marine and ocean monitoring technologies for applications including wave monitoring, oceanographic research, offshore engineering, and integrated marine observation.
Our solutions include wave sensors, tide and wave gauges, observation buoys, ADCPs, CTD systems, and other marine monitoring equipment.
Post time: Sep-17-2026